The protein expression bar, with the units none (n), low (l), medium (m) and high (h), is based on a best estimate of the "true" protein expression for proteins where the antibody staining pattern has been analyzed by knowledge-based annotation. For genes where more than one antibody has been used, a common score is set. For details, see
Assays & annotation.
RNA expression shows average values based on RNA-seq data generated by HPA or the Genotype-Tissue Expression (
GTEx) consortium.
HPA RNA expression data are reported as number of Fragments Per Kilobase gene model and Million reads (FPKM). For details, see
Assays & annotation.
GTEx RNA expression data are reported as reads per kilobase per million mapped reads (RPKM). For details, see
Assays & annotation.


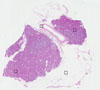 Female, age 59

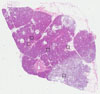 Male, age 60

