|
Antibody HPA006286
|
|
Antibody HPA007007
|
|
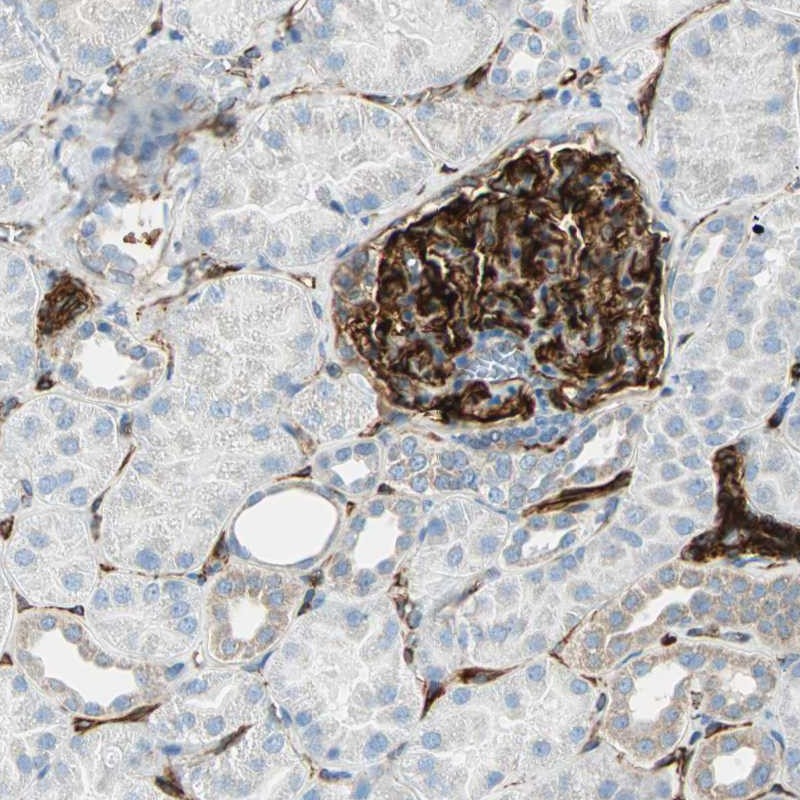
Antibody HPA026111
|
|
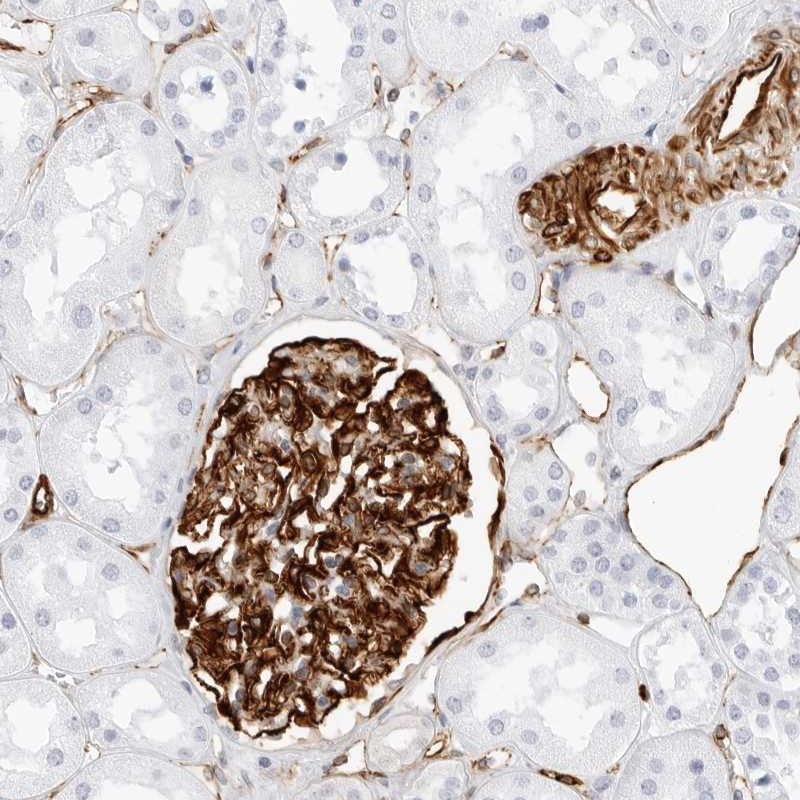
Antibody CAB005889
|
|
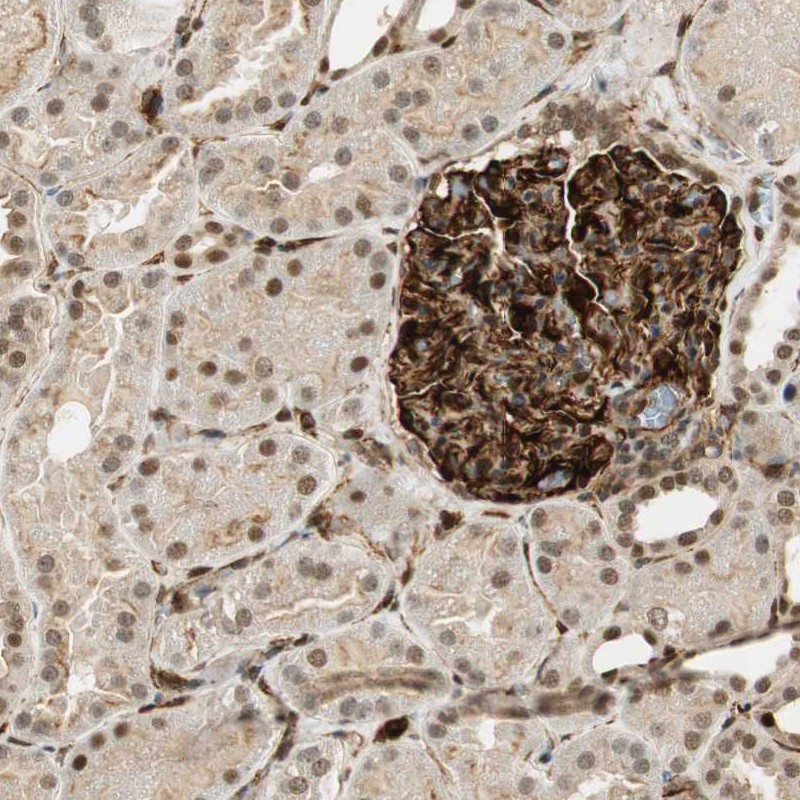
Antibody CAB058692
|
|
|
ANTIBODY INFORMATION
|
|
Provider |
Atlas Antibodies
Sigma-Aldrich
| | Atlas Antibodies
Sigma-Aldrich
| | Atlas Antibodies
Sigma-Aldrich
| | Abcam plc
| | Atlas Antibodies
Sigma-Aldrich
| |
Product name |
HPA006286 | | HPA007007 | | HPA026111 | | ab5968 | | AMAb90556 | |
Host species |
Rabbit | | Rabbit | | Rabbit | | Rabbit | | Mouse | |
Clonality |
pAb | | pAb | | pAb | | msAb | | mAb | |
Purity |
Affinity purified using the PrEST-antigen as affinity ligand | | Affinity purified using the PrEST-antigen as affinity ligand | | Affinity purified using the PrEST-antigen as affinity ligand | | Affinity | | Protein A/G | |
Released in version |
14 | | 4 | | 5 | | 3 | | 11 | |
|
ANTIGEN INFORMATION
|
|
Antigen |
Recombinant protein fragment | | Recombinant protein fragment | | Recombinant protein fragment | | Synthetic peptide | | Recombinant protein | |
Length (aa) |
119 | | 119 | | 144 | | | | | |
Antigen sequence |
DPEGQSQQVGAPGLQAPQGLPEAIEPLVEDDVAPGGDQASPEVMLGSEPA
MGESAAGAEPGPGQGVGGLGDPGHLTREEVMEPPLEEESLEAKRVQGLEG
PRKDLEEAGGLGTEFSELP
| | DPEGQSQQVGAPGLQAPQGLPEAIEPLVEDDVAPGGDQASPEVMLGSEPA
MGESAAGAEPGPGQGVGGLGDPGHLTREEVMEPPLEEESLEAKRVQGLEG
PRKDLEEAGGLGTEFSELP
| | EPLRSLEDENKEAFRSLEKENQEPLKTLEEEDQSIVRPLETENHKSLRSL
EEQDQETLRTLEKETQQRRRSLGEQDQMTLRPPEKVDLEPLKSLDQEIAR
PLENENQEFLKSLKEESVEAVKSLETEILESLKSAGQENLETLK
| |
| |
| |
Matching transcripts |
NES-001 - ENSP00000357206 [100%]
| | NES-001 - ENSP00000357206 [100%]
| | NES-001 - ENSP00000357206 [100%]
| | | | | |
Other gene match |
| | | | | | | | | |
|
ANTIBODY VALIDATION
|
|
|
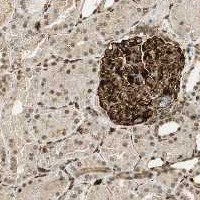
Immunohistochemistry
|
|
Image |
| |  | |  | |  | |  | |
Description |
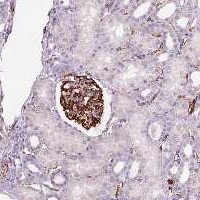
Application not done for this antibody. | | Immunohistochemical staining of human kidney shows distinct positivity in cells in glomeruli.
More information | | Immunohistochemical staining of human kidney shows strong cytoplasmic positivity in glomeruli and endothlial cells.
More information | | Immunohistochemical staining of human kidney shows strong cytoplasmic positivity in cells in glomeruli.
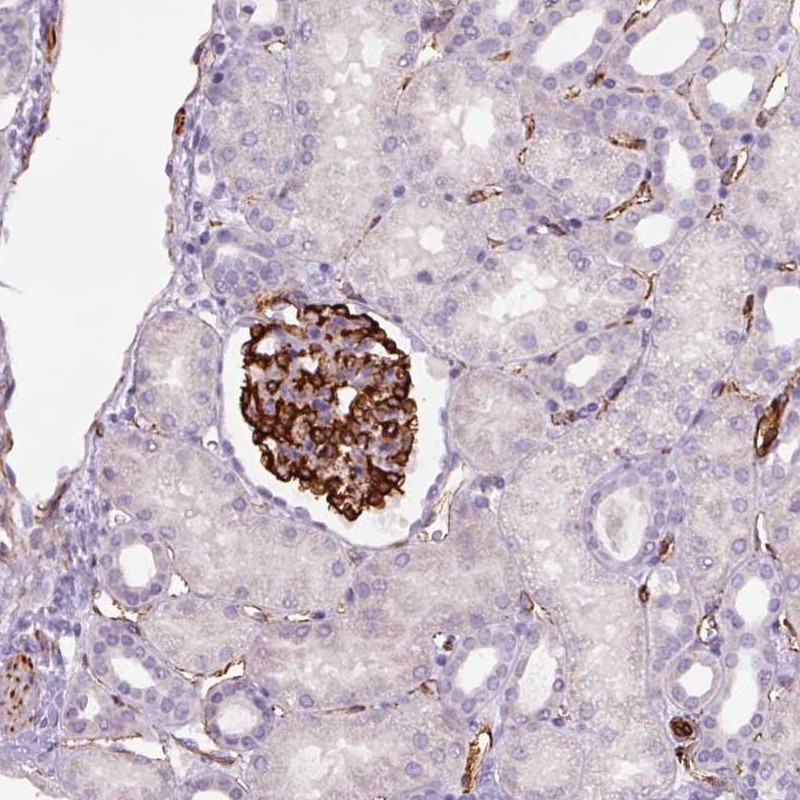
More information | | Immunohistochemical staining of human kidney shows strong cytoplasmic positivity in cells in glomeruli.
More information | |
Retrieval method |
| | HIER pH6 | | HIER pH6 | | HIER pH6 | | HIER pH6 | |
Antibody dilution |
| | 1:250 | | 1:3000 | | 1:1000 | | 1:3500 | |
Literature conformity |
| | Partly consistent with extensive gene/protein characterization data | | Partly consistent with extensive gene/protein characterization data | | Partly consistent with extensive gene/protein characterization data | | Partly consistent with extensive gene/protein characterization data | |
RNA consistency |
| | Not done | | Not done | | Not done | | Not done | |
|
Immunofluorescence
|
|
Image |
 | | | |  | |  | | | |
Description |
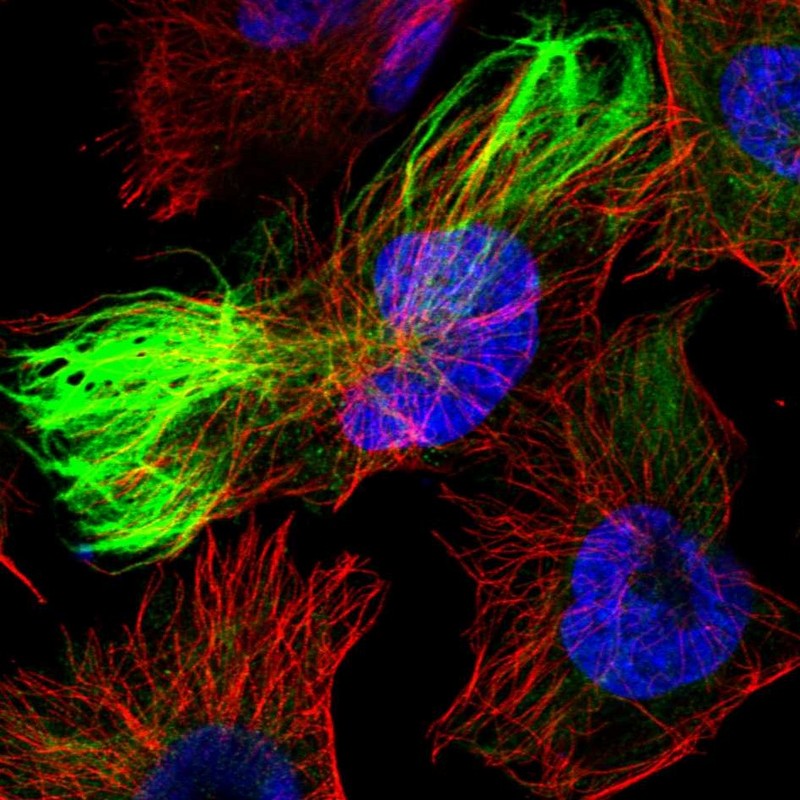
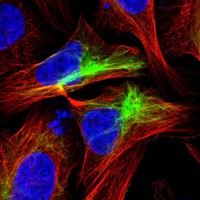
Immunofluorescent staining of human cell line U-2 OS shows positivity in intermediate filaments.
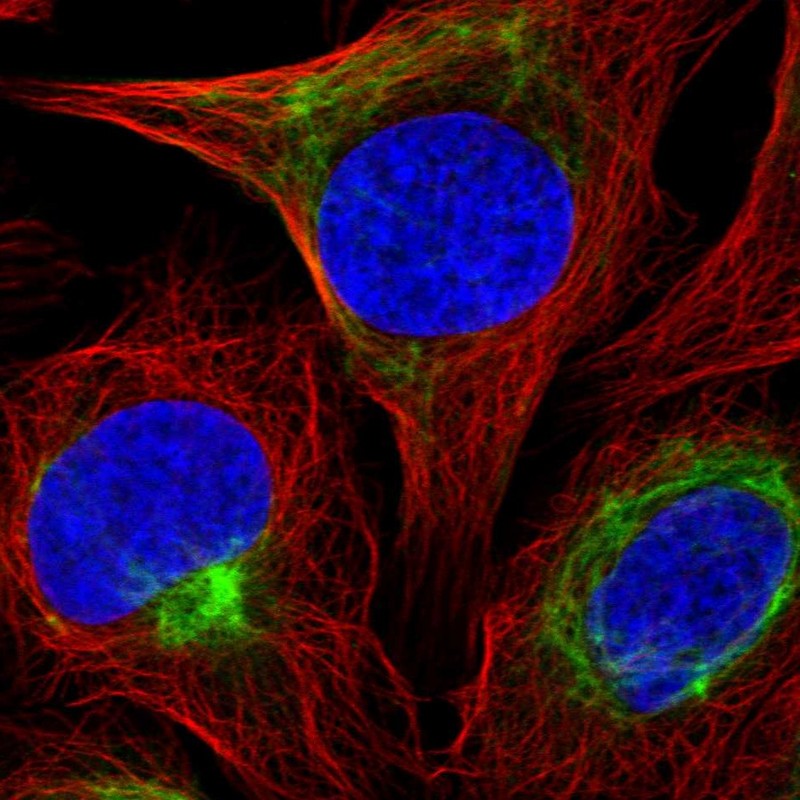
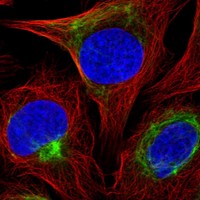
More information | | Application not done for this antibody. | | Immunofluorescent staining of human cell line U-251 MG shows positivity in intermediate filaments.
More information | | Immunofluorescent staining of human cell line U-2 OS shows positivity in intermediate filaments.
More information | | Application not done for this antibody. | |
Antibody dilution |
1:60 | | | | 1:200 | | 1:200 | | | |
Validation IF |
Supportive: The subcellular location is supported by experimental gene/protein characterization data, gene silencing, or an independent antibody. | | | | Supportive: The subcellular location is supported by experimental gene/protein characterization data, gene silencing, or an independent antibody. | | Supportive: The subcellular location is supported by experimental gene/protein characterization data, gene silencing, or an independent antibody. | | | |
|
GFP
|
|
Image |
 | | | |  | | | | | |
Description |
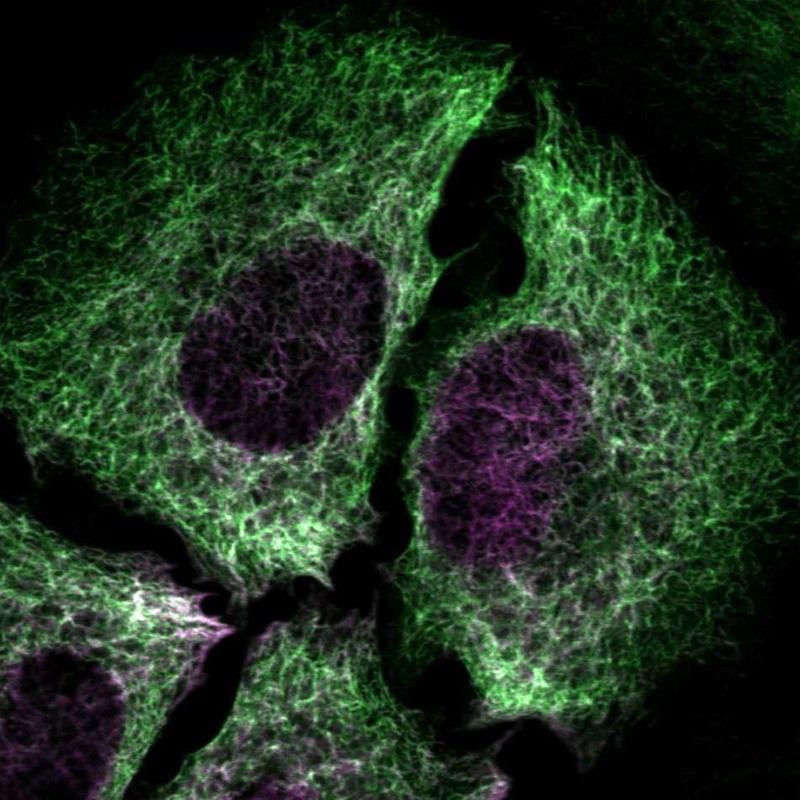
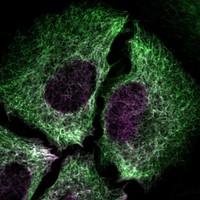
Immunofluorescent staining of transgenic HeLa cells show antibody staining in intermediate filaments and GFP expression in intermediate filaments.
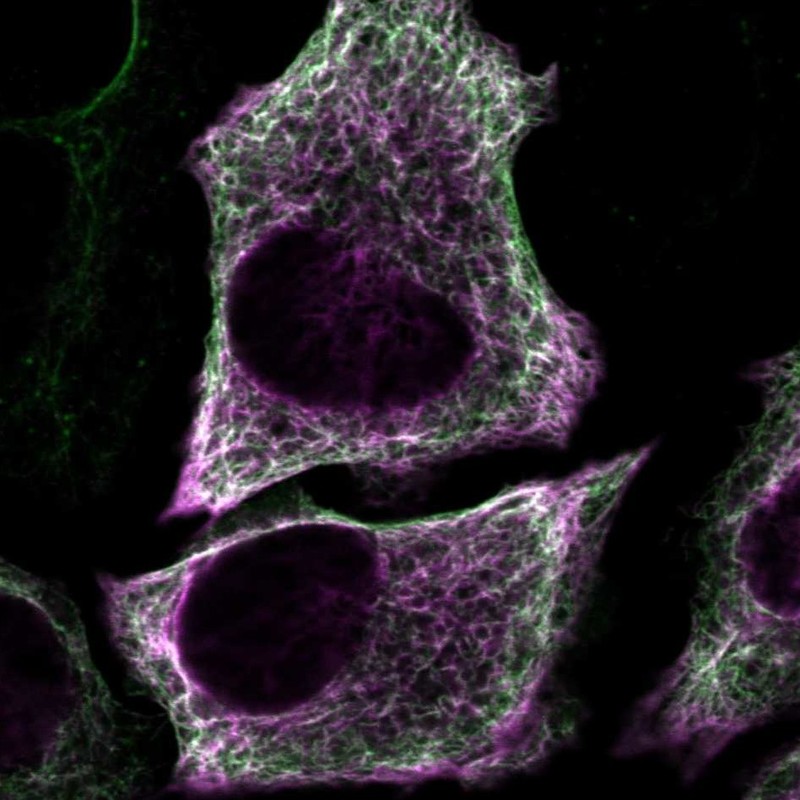
More information | | Application not done for this antibody. | | Immunofluorescent staining of transgenic HeLa cells show antibody staining in intermediate filaments and GFP expression in intermediate filaments.
More information | | Application not done for this antibody. | | Application not done for this antibody. | |
Antibody dilution |
1:60 | | | | 1:200 | | | | | |
Validation IFGFP |
Supportive: Antibody staining overlaps with GFP tagged protein | | | | Supportive: Antibody staining overlaps with GFP tagged protein | | | | | |
|
Western blot - siRNA
|
|
Image |
| |  | | | | | | | |
Description |
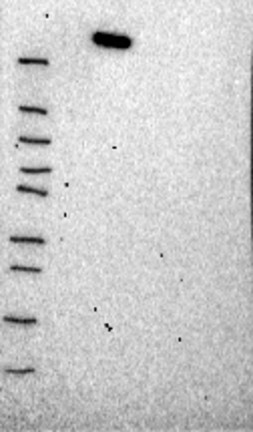
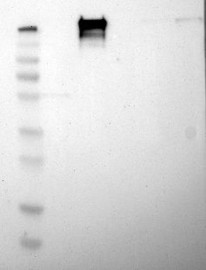
Application not done for this antibody. | | Lane 1: Marker [kDa] 250, 130, 95, 72, 55, 36, 28, 17, 10
Lane 2: siRNA 1
Lane 3: siRNA 2
Lane 4: Scrambled
More information | | Application not done for this antibody. | | Application not done for this antibody. | | Application not done for this antibody. | |
Target mass (kDa) |
| | 177.4 | | | | | | | |
Loading control |
| | Total protein image | | | | | | | |
Antibody dilution |
| | 1:81 | | | | | | | |
Validation WB-siRNA |
| | Supportive: Downregulation visible in both siRNA lanes | | | | | | | |
|
Western Blot
|
|
Image |
 | |  | | | |  | |  | |
Description |
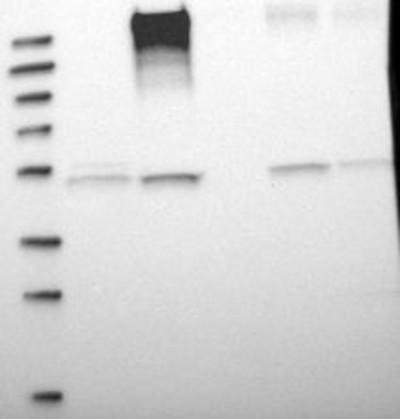
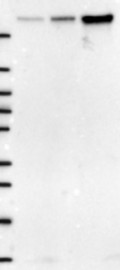
Lane 1: Marker [kDa] 230, 130, 95, 72, 56, 36, 28, 17, 11
Lane 2: RT4
Lane 3: U-251 MG
Lane 4: Human Plasma
Lane 5: Liver
Lane 6: Tonsil
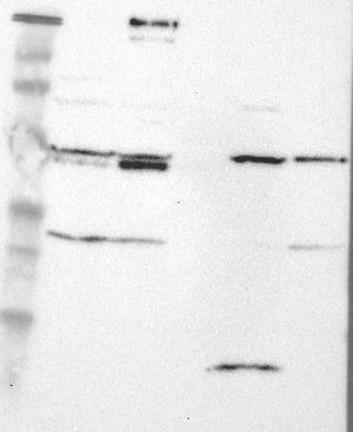
More information | | Lane 1: Marker [kDa] 230, 130, 95, 72, 56, 36, 28, 17, 11
Lane 2: RT4
Lane 3: U-251 MG
Lane 4: Human Plasma
Lane 5: Liver
Lane 6: Tonsil
More information | | | | Lane 1: Marker [kDa] 229, 112, 83.5, 47.9, 32.3, 26.5, 17.2
Lane 2: RT4
Lane 3: U-251 MG
Lane 4: Human Plasma
Lane 5: Liver
Lane 6: Tonsil
More information | | Lane 1: Marker [kDa] 250, 130, 100, 70, 55, 35, 25, 15, 10
Lane 2: RT4
Lane 3: U-251 MG
Lane 4: Human Plasma
Lane 5: Liver
Lane 6: Tonsil
More information | |
Target mass (kDa) |
177.4 | | 177.4 | | 177.4 | | 177.4 | | 177.4 | |
Antibody dilution |
1:250 | | 1:250 | | 1:250 | | 1:500 | | 1:500 | |
Validation WB |
Supportive: Band of predicted size in kDa (+/-20%) with additional bands present | | Supportive: Single band corresponding to the predicted size in kDa (+/-20%) | | Non-supportive: Weak band of predicted size but with additional bands of higher intensity also present | | Supportive: Band of predicted size in kDa (+/-20%) with additional bands present | | Uncertain: Single band differing more than +/-20% from predicted size in kDa and not supported by experimental and/or bioinformatic data | |
|
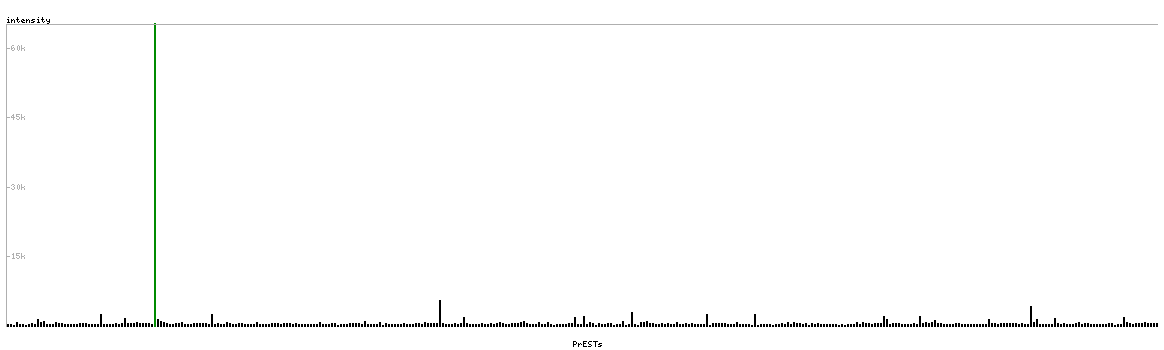
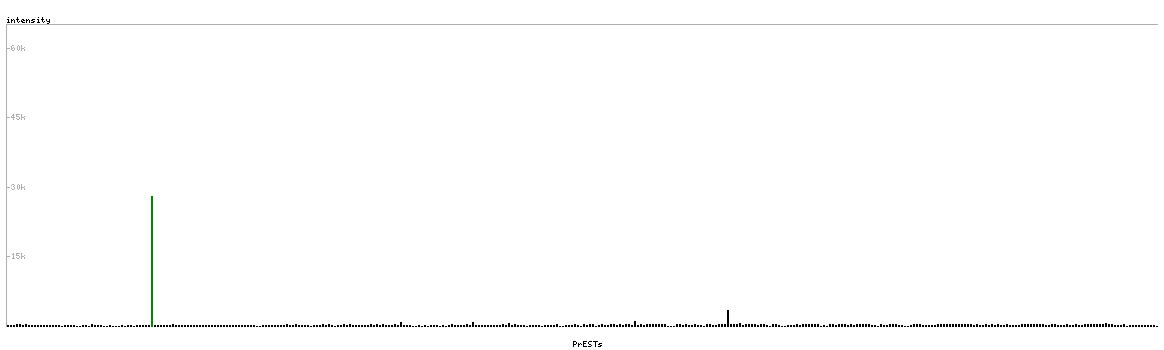
Protein array
|
|
Image |
 | |  | |  | | | | | |
Description |
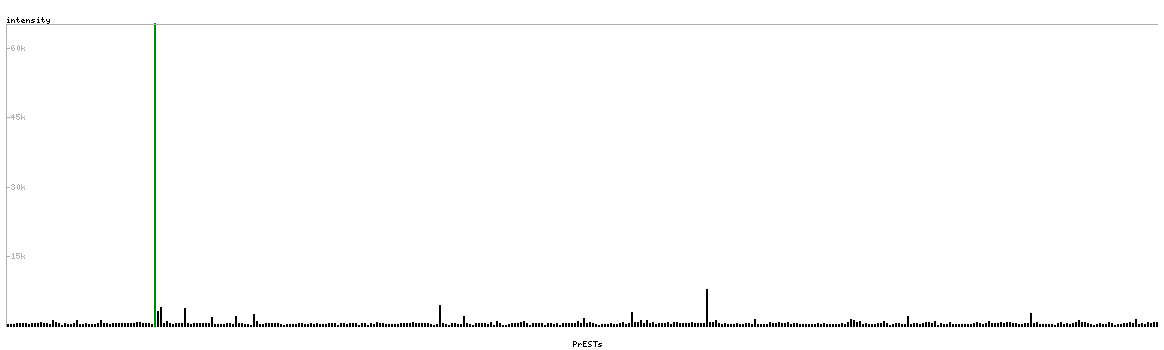
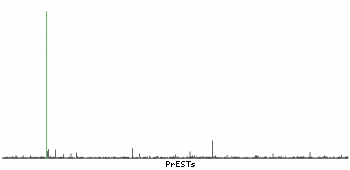
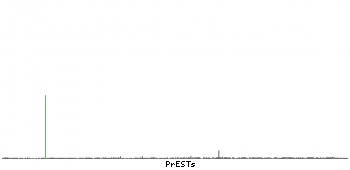
Antibody specificity analysis with protein arrays. Predicted and matching interactions are shown in green.
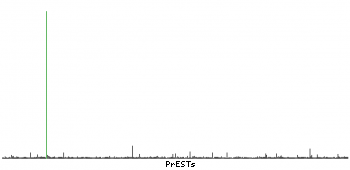
More information | | Antibody specificity analysis with protein arrays. Predicted and matching interactions are shown in green.
More information | | Antibody specificity analysis with protein arrays. Predicted and matching interactions are shown in green.
More information | | Application not done for this antibody. | | Application not done for this antibody. | |
Antibody dilution |
1:3000 | | 1:3000 | | 1:3000 | | | | | |
Validation PA |
Uncertain: Pass with quality comment low specificity (binding to 1-2 PrESTs >15% and <40%). | | Supportive: Pass with single peak corresponding to interaction only with its own antigen. | | Supportive: Pass with single peak corresponding to interaction only with its own antigen. | | | | | |
| |