|
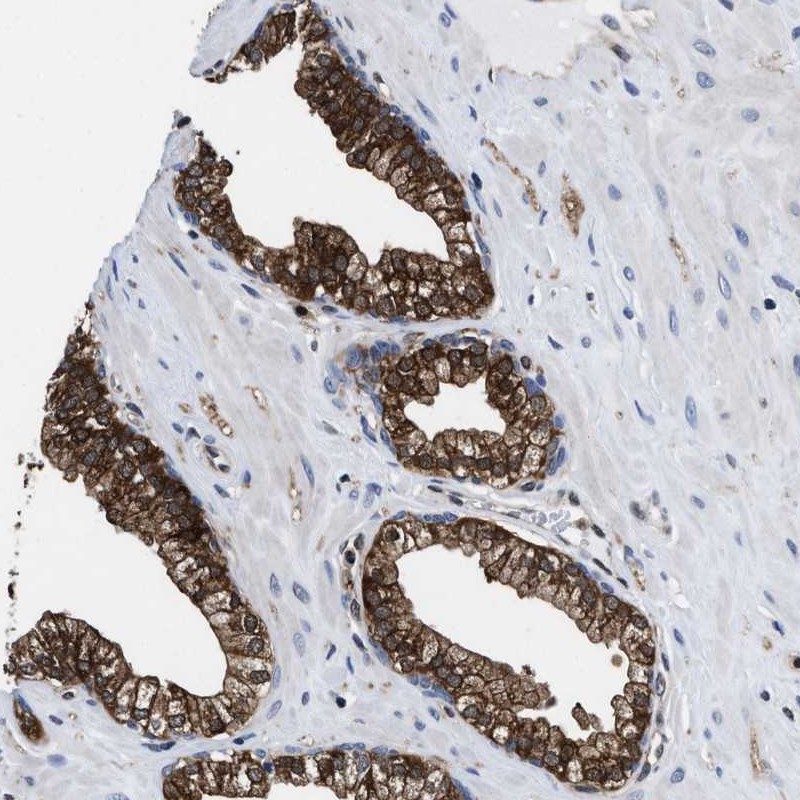
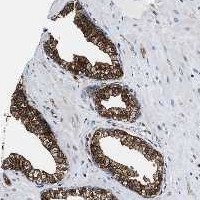
Antibody HPA022434
|
|
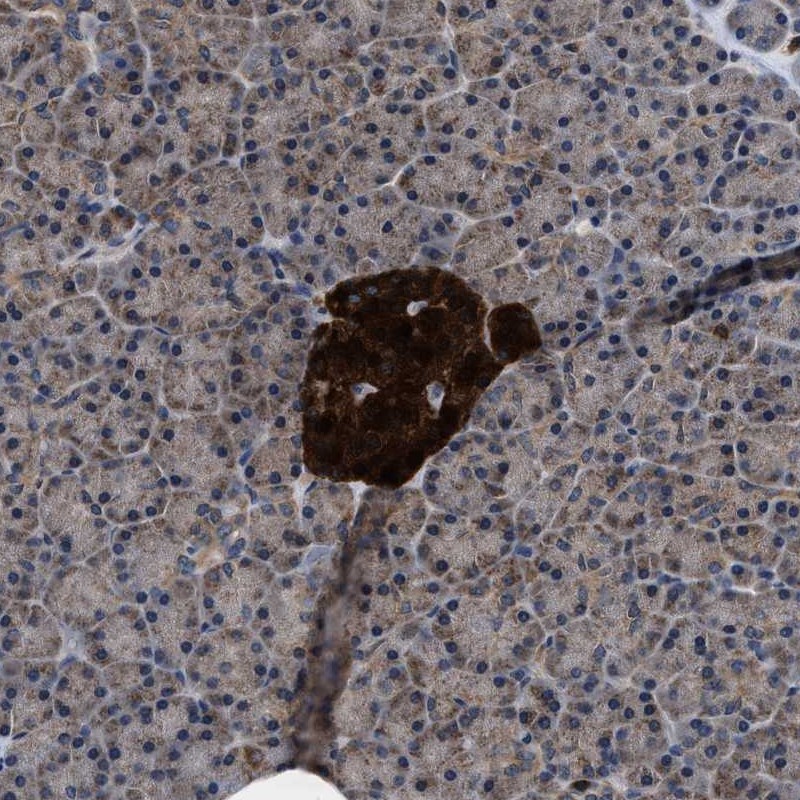
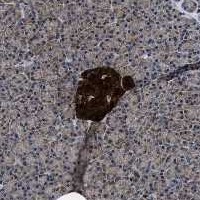
Antibody HPA022953
|
|
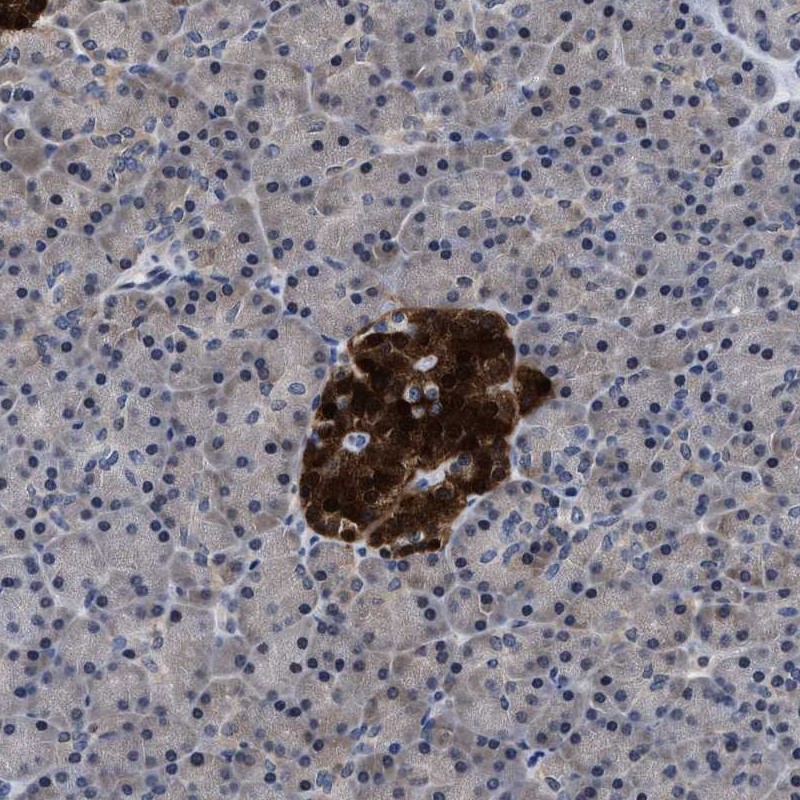
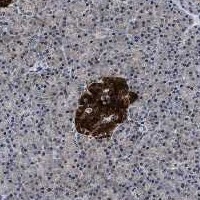
Antibody HPA022959
|
|
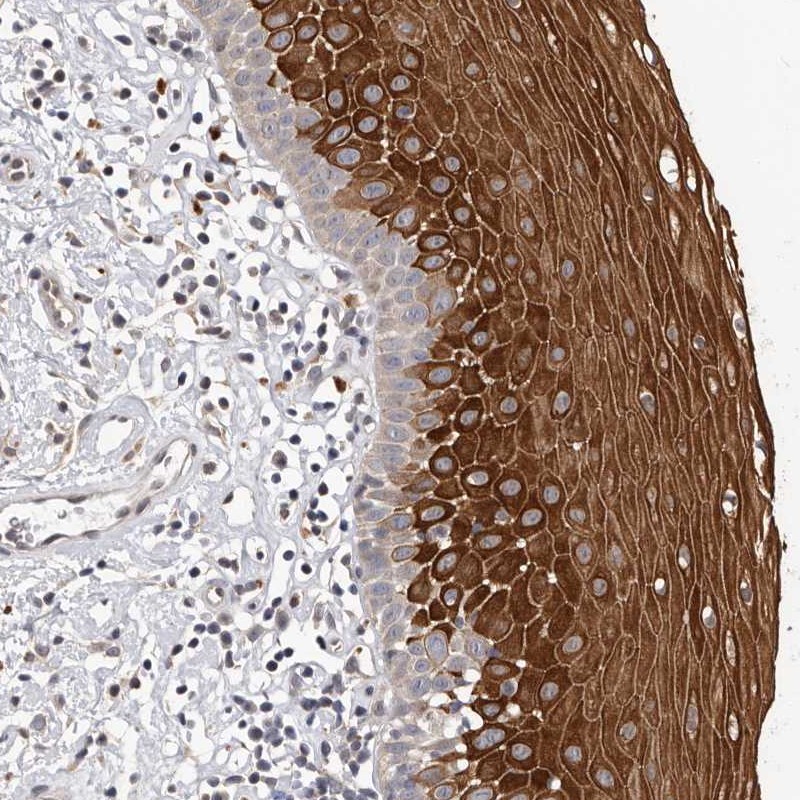
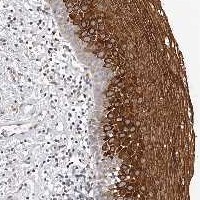
Antibody HPA028758
|
|
Antibody CAB007783
|
|
|
ANTIBODY INFORMATION
|
|
Provider |
Atlas Antibodies
Sigma-Aldrich
| | Atlas Antibodies
Sigma-Aldrich
| | Atlas Antibodies
Sigma-Aldrich
| | Atlas Antibodies
Sigma-Aldrich
| | Epitomics
| |
Product name |
HPA022434 | | HPA022953 | | HPA022959 | | HPA028758 | | 1699-1 | |
Host species |
Rabbit | | Rabbit | | Rabbit | | Rabbit | | Rabbit | |
Clonality |
pAb | | pAb | | pAb | | pAb | | mAb | |
Purity |
Affinity purified using the PrEST-antigen as affinity ligand | | Affinity purified using the PrEST-antigen as affinity ligand | | Affinity purified using the PrEST-antigen as affinity ligand | | Affinity purified using the PrEST-antigen as affinity ligand | | Supernatant | |
Released in version |
5 | | 5 | | 5 | | 6 | | 3 | |
|
ANTIGEN INFORMATION
|
|
Antigen |
Recombinant protein fragment | | Recombinant protein fragment | | Recombinant protein fragment | | Recombinant protein fragment | | Synthetic peptide | |
Length (aa) |
97 | | 98 | | 101 | | 90 | | | |
Antigen sequence |
AEEFYVCIYATREGDYVLFHHEGGVDVGDVDAKAQKLLVGVDEKLNPEDI
KKHLLVHAPEDKKEILASFISGLFNFYEDLYFTYLEINPLVVTKDGV
| | CANQASETAVAKNQALKEAGVFVPRSFDELGEIIQSVYEDLVANGVIVPA
QEVPPPTVPMDYSWARELGLIRKPASFMTSICDERGQELIYAGMPITE
| | YICKVKWGDIEFPPPFGREAYPEEAYIADLDAKSGASLKLTLLNPKGRIW
TMVAGGGASVVYSDTICDLGGVNELANYGEYSGAPSEQQTYDYAKTILSL
M
| | TTSAIQNRFKYARVTPDTDWARLLQDHPWLLSQNLVVKPDQLIKRRGKLG
LVGVNLTLDGVKSWLKPRLGQEATVGKATGFLKNFLIEPF
| |
| |
Matching transcripts |
ACLY-001 - ENSP00000253792 [100%]
ACLY-002 - ENSP00000377474 [100%]
ACLY-003 - ENSP00000466259 [100%]
ACLY-201 - ENSP00000345398 [100%]
| | ACLY-001 - ENSP00000253792 [100%]
ACLY-002 - ENSP00000377474 [100%]
ACLY-003 - ENSP00000466259 [100%]
ACLY-004 - ENSP00000445349 [100%]
ACLY-201 - ENSP00000345398 [100%]
| | ACLY-001 - ENSP00000253792 [100%]
ACLY-002 - ENSP00000377474 [100%]
ACLY-003 - ENSP00000466259 [100%]
ACLY-201 - ENSP00000345398 [100%]
| | ACLY-001 - ENSP00000253792 [100%]
ACLY-002 - ENSP00000377474 [100%]
ACLY-003 - ENSP00000466259 [100%]
ACLY-201 - ENSP00000345398 [100%]
ACLY-005 - ENSP00000468705 [99%]
ACLY-004 - ENSP00000445349 [82%]
| | | |
Other gene match |
| | | | | | | | | |
|
ANTIBODY VALIDATION
|
|
|
Immunohistochemistry
|
|
Image |
 | |  | |  | |  | |  | |
Description |
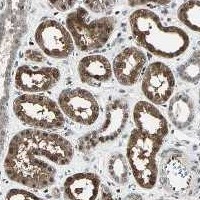
Immunohistochemical staining of human prostate shows strong cytoplasmic positivity in glandular cells.
More information | | Immunohistochemical staining of human pancreas shows strong cytoplasmic positivity in islet cells.
More information | | Immunohistochemical staining of human pancreas shows strong cytoplasmic and nuclear positivity in islet cells.
More information | | Immunohistochemical staining of human oral mucosa shows strong cytoplasmic positivity in squamous epithelial cells.
More information | | Immunohistochemical staining of human kidney shows distinct nuclear and cytoplasmic positivity in cells in tubules.
More information | |
Retrieval method |
HIER pH6 | | HIER pH6 | | HIER pH6 | | HIER pH6 | | HIER pH6 | |
Antibody dilution |
1:75 | | 1:35 | | 1:90 | | 1:20 | | 1:200 | |
Literature conformity |
Partly consistent with extensive gene/protein characterization data | | Partly consistent with extensive gene/protein characterization data | | Partly consistent with extensive gene/protein characterization data | | Partly consistent with extensive gene/protein characterization data | | Partly consistent with extensive gene/protein characterization data | |
RNA consistency |
Not done | | Not done | | Not done | | Not done | | Not done | |
|
Immunofluorescence
|
|
Image |
 | |  | |  | |  | |  | |
Description |
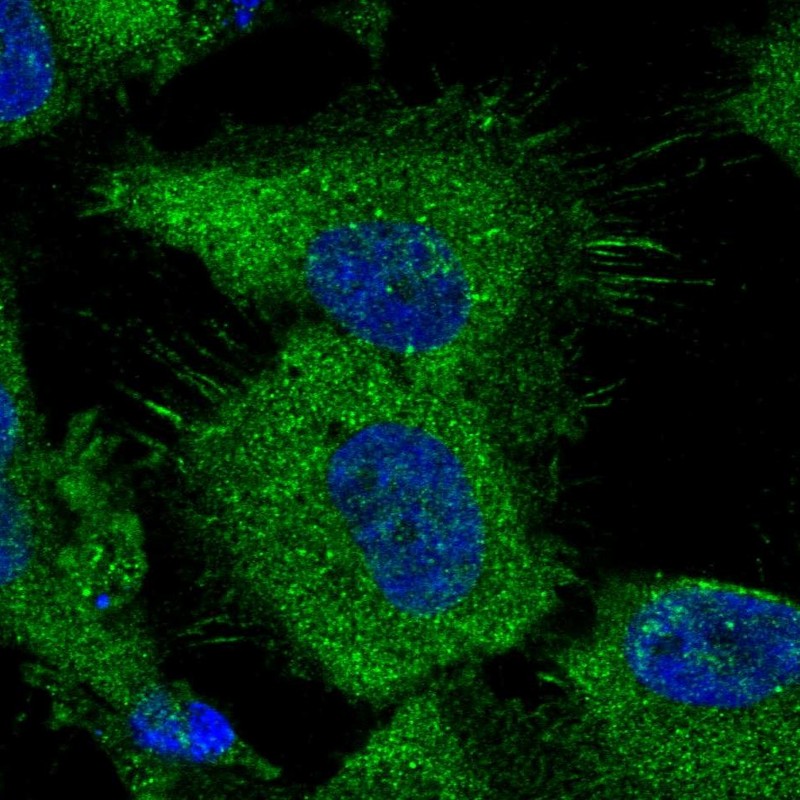
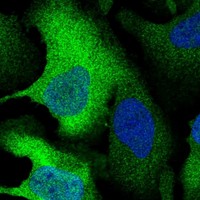
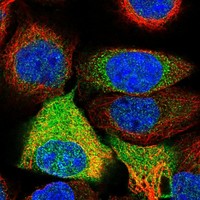
Immunofluorescent staining of human cell line U-2 OS shows positivity in plasma membrane & cytoplasm.
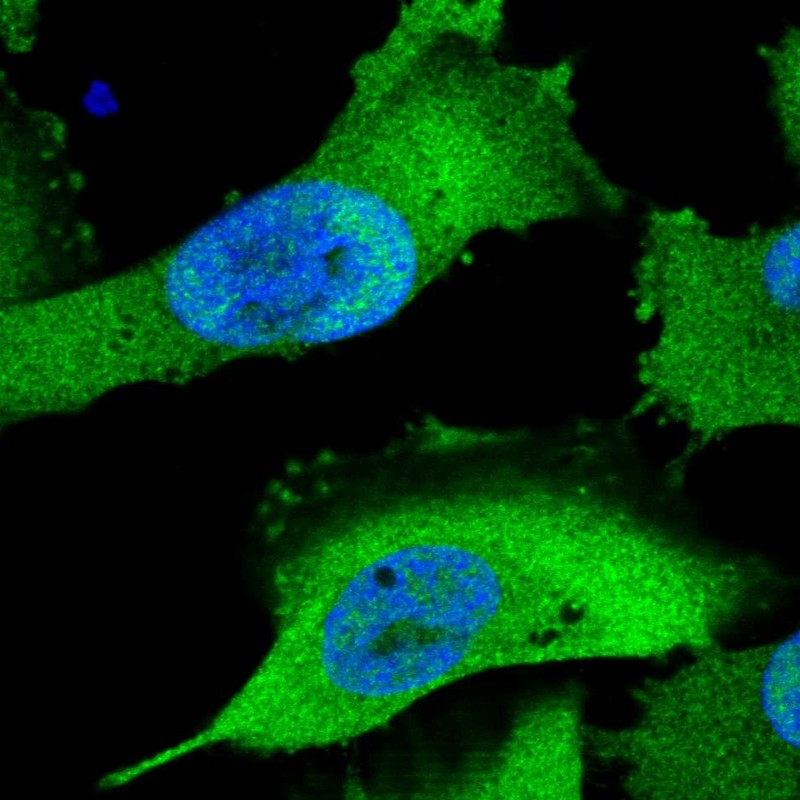
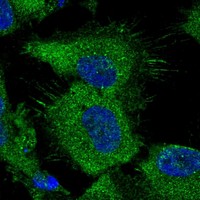
More information | | Immunofluorescent staining of human cell line U-251 MG shows positivity in plasma membrane & cytoplasm.
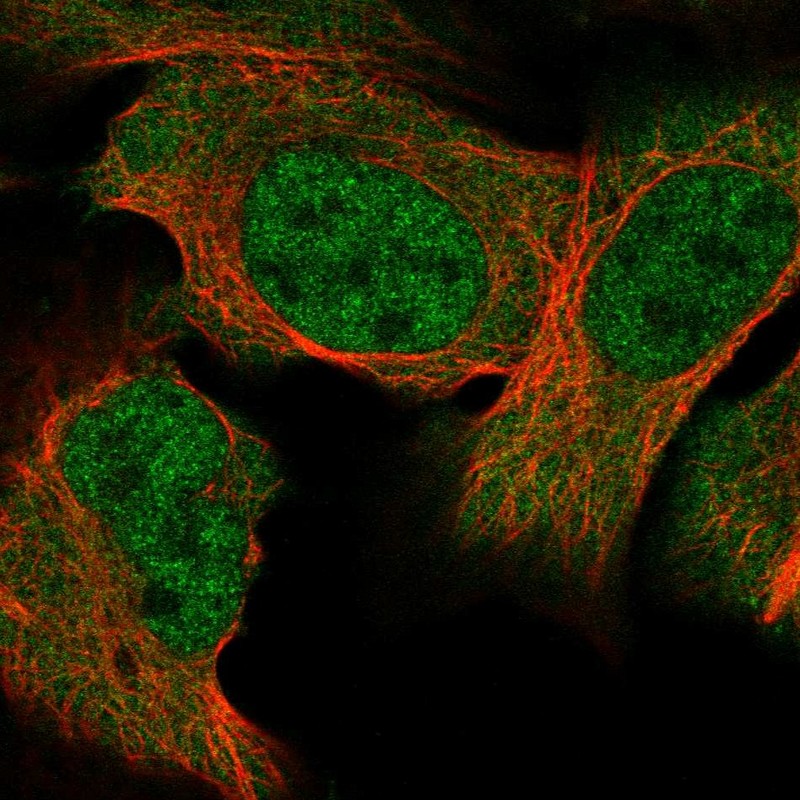
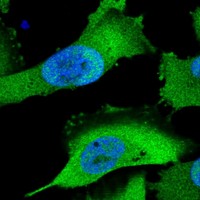
More information | | Immunofluorescent staining of human cell line U-251 MG shows positivity in plasma membrane, cytoplasm & nucleus but excluded from the nucleoli.
More information | | Immunofluorescent staining of human cell line A-431 shows positivity in cytoplasm & nucleus but excluded from the nucleoli.
More information | | Immunofluorescent staining of human cell line U-2 OS shows positivity in cytoplasm & nucleus but excluded from the nucleoli.
More information | |
Antibody dilution |
1:10 | | 1:10 | | 1:20 | | 1:20 | | 1:50 | |
Validation IF |
Supportive: The subcellular location is supported by experimental gene/protein characterization data, gene silencing, or an independent antibody. | | Supportive: The subcellular location is supported by experimental gene/protein characterization data, gene silencing, or an independent antibody. | | Supportive: The subcellular location is supported by experimental gene/protein characterization data, gene silencing, or an independent antibody. | | Supportive: The subcellular location is supported by experimental gene/protein characterization data, gene silencing, or an independent antibody. | | Supportive: The subcellular location is supported by experimental gene/protein characterization data, gene silencing, or an independent antibody. | |
|
Western Blot
|
|
Image |
 | |  | |  | |  | |  | |
Description |
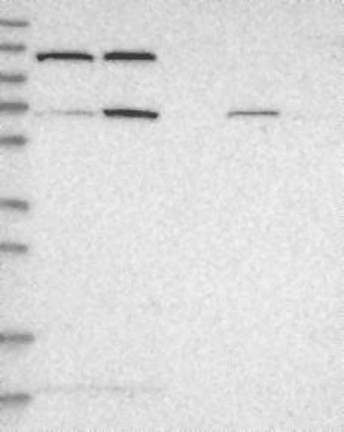
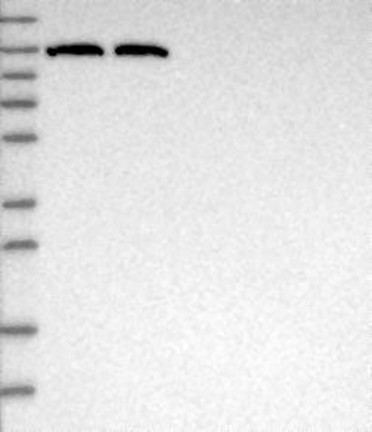
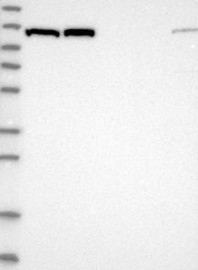
Lane 1: Marker [kDa] 230, 130, 95, 72, 56, 36, 28, 17, 11
Lane 2: RT4
Lane 3: U-251 MG
Lane 4: Human Plasma
Lane 5: Liver
Lane 6: Tonsil
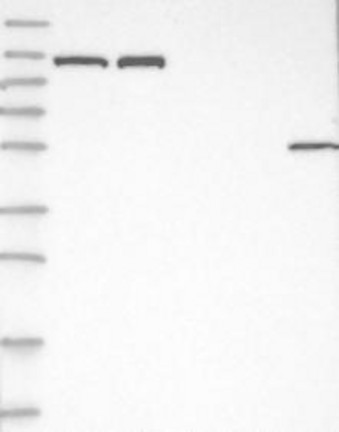
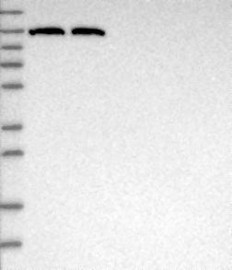
More information | | Lane 1: Marker [kDa] 230, 130, 95, 72, 56, 36, 28, 17, 11
Lane 2: RT4
Lane 3: U-251 MG
Lane 4: Human Plasma
Lane 5: Liver
Lane 6: Tonsil
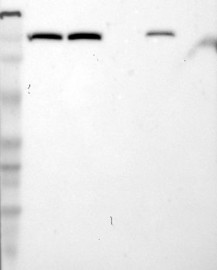
More information | | Lane 1: Marker [kDa] 230, 130, 95, 72, 56, 36, 28, 17, 11
Lane 2: RT4
Lane 3: U-251 MG
Lane 4: Human Plasma
Lane 5: Liver
Lane 6: Tonsil
More information | | Lane 1: Marker [kDa] 230, 130, 95, 72, 56, 36, 28, 17, 11
Lane 2: RT4
Lane 3: U-251 MG
Lane 4: Human Plasma
Lane 5: Liver
Lane 6: Tonsil
More information | | Lane 1: Marker [kDa] 220, 112, 84, 47, 32, 26, 16.8
Lane 2: RT4
Lane 3: U-251 MG
Lane 4: Human Plasma
Lane 5: Liver
Lane 6: Tonsil
More information | |
Target mass (kDa) |
120.8, 119.8 | | 120.8, 119.8, 91.1 | | 120.8, 119.8 | | 120.8, 119.8, 91.1, 12.3 | | 120.8, 119.8, 91.1, 14.2, 12.3 | |
Antibody dilution |
1:250 | | 1:250 | | 1:250 | | 1:250 | | 1:500 | |
Validation WB |
Supportive: Single band corresponding to the predicted size in kDa (+/-20%) | | Supportive: Band of predicted size in kDa (+/-20%) with additional bands present | | Supportive: Single band corresponding to the predicted size in kDa (+/-20%) | | Supportive: Band of predicted size in kDa (+/-20%) with additional bands present | | Supportive: Single band corresponding to the predicted size in kDa (+/-20%) | |
|
Protein array
|
|
Image |
 | |  | |  | |  | | | |
Description |
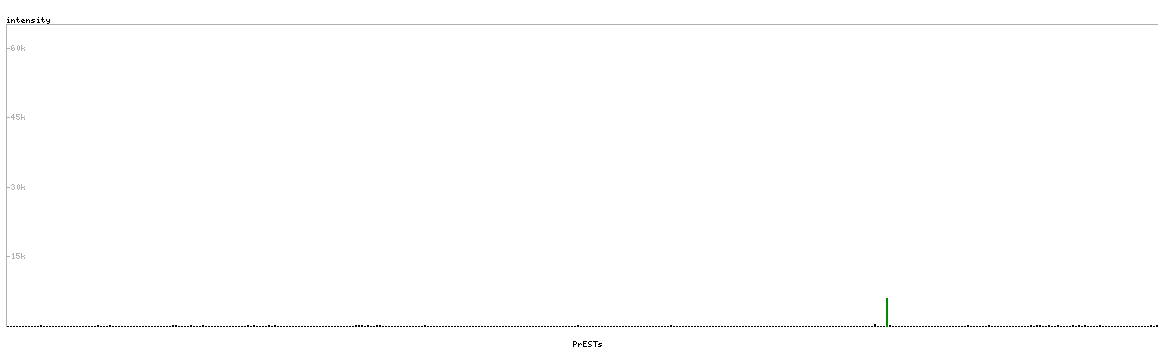
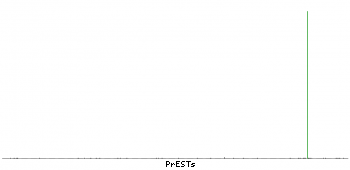
Antibody specificity analysis with protein arrays. Predicted and matching interactions are shown in green.
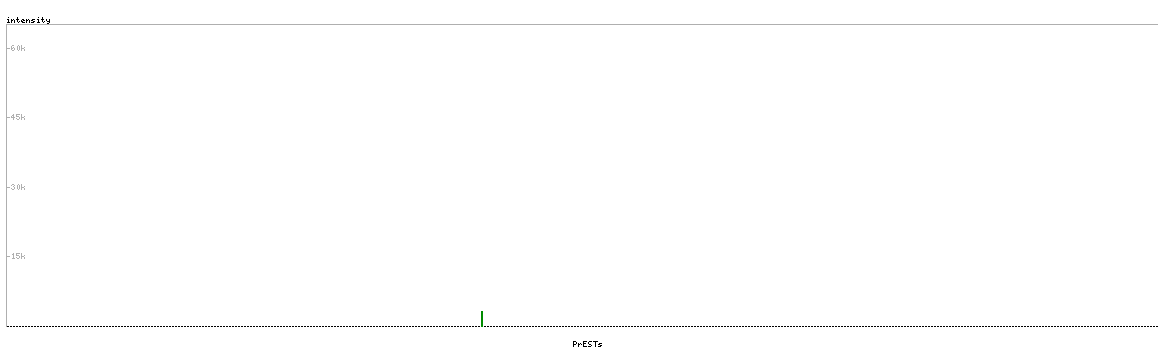
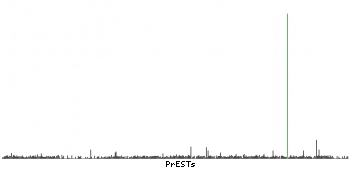
More information | | Antibody specificity analysis with protein arrays. Predicted and matching interactions are shown in green.
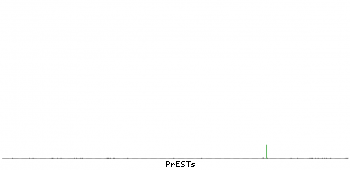
More information | | Antibody specificity analysis with protein arrays. Predicted and matching interactions are shown in green.
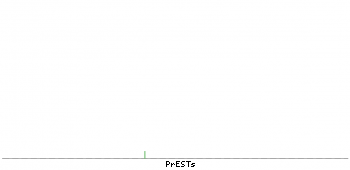
More information | | Antibody specificity analysis with protein arrays. Predicted and matching interactions are shown in green.
More information | | Application not done for this antibody. | |
Antibody dilution |
1:500 | | 1:500 | | 1:3000 | | 1:3000 | | | |
Validation PA |
Supportive: Pass with single peak corresponding to interaction only with its own antigen. | | Supportive: Pass with single peak corresponding to interaction only with its own antigen. | | Supportive: Pass with single peak corresponding to interaction only with its own antigen. | | Supportive: Pass with single peak corresponding to interaction only with its own antigen. | | | |
| |