|
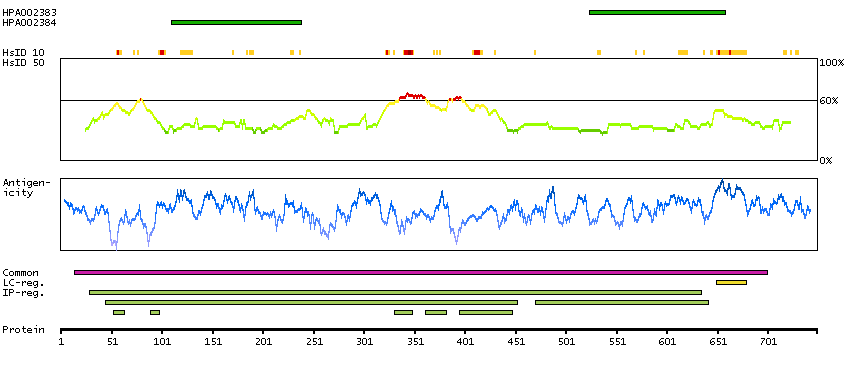
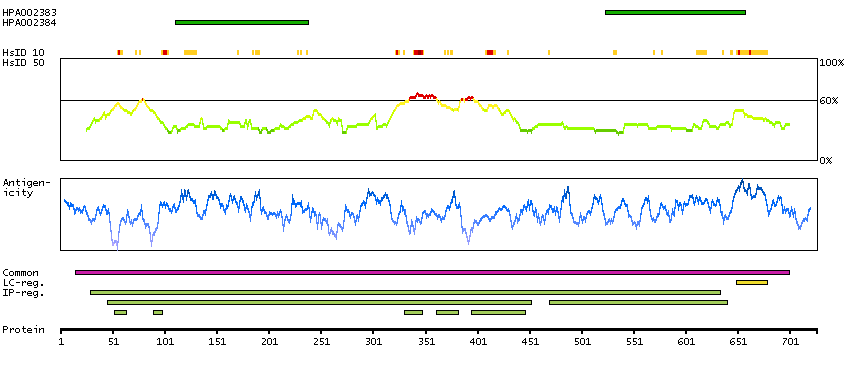
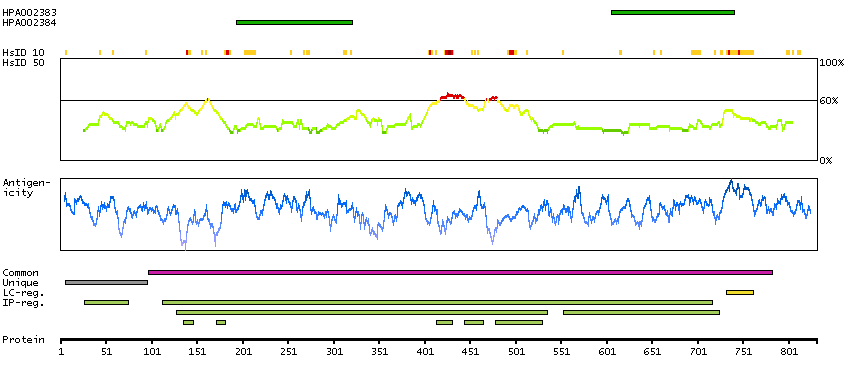
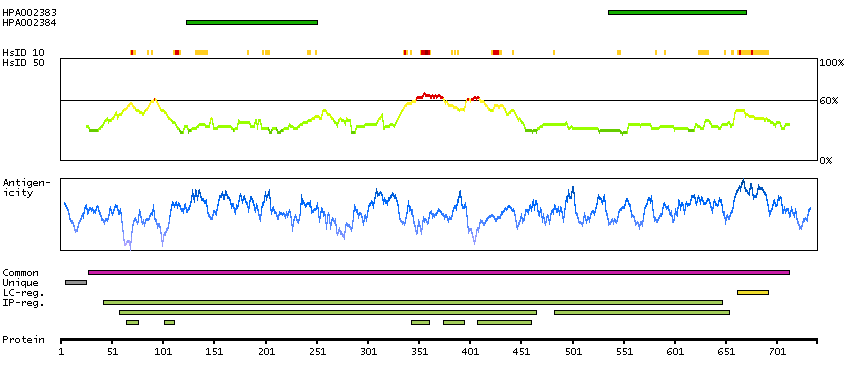
Antibody HPA002383
|
|
Antibody HPA002384
|
|
Antibody CAB075734
|
|
Antibody CAB075735
|
|
Antibody CAB075736
|
|
Antibody CAB075737
|
|
|
ANTIBODY INFORMATION
|
|
Provider |
Atlas Antibodies
Sigma-Aldrich
| | Atlas Antibodies
Sigma-Aldrich
| | Atlas Antibodies
Sigma-Aldrich
| | Atlas Antibodies
Sigma-Aldrich
| | Atlas Antibodies
Sigma-Aldrich
| | Atlas Antibodies
Sigma-Aldrich
| |
Product name |
HPA002383 | | HPA002384 | | AMAb90970 | | AMAb90971 | | AMAb90972 | | AMAb90973 | |
Host species |
Rabbit | | Rabbit | | Mouse | | Mouse | | Mouse | | Mouse | |
Clonality |
pAb | | pAb | | mAb | | mAb | | mAb | | mAb | |
Purity |
Affinity purified using the PrEST-antigen as affinity ligand | | Affinity purified using the PrEST-antigen as affinity ligand | | Protein A/G | | Protein A/G | | Protein A/G | | Protein A/G | |
Released in version |
2 | | 4 | | 14 | | 14 | | 14 | | 14 | |
|
ANTIGEN INFORMATION
|
|
Antigen |
Recombinant protein fragment | | Recombinant protein fragment | | Recombinant protein | | Recombinant protein | | Recombinant protein | | Recombinant protein | |
Length (aa) |
136 | | 129 | | | | | | | | | |
Antigen sequence |
SQCNLYMAARKAVRKRPNQALLENIALYLTHMLKIFGAVEEDSSLGFPVG
GPGTSLSLEATVMPYLQVLSEFREGVRKIAREQKVPEILQLSDALRDNIL
PELGVRFEDHEGLPTVVKLVDRNTLLKEREEKRRVE
| | HLFEQYREKRPEAAQLLEDVQAALKPFSVKLNETTDPDKKQMLERIQHAV
QLATEPLEKAVQSRLTGEEVNSCVEVLLEEAKDLLSDWLDSTLGCDVTDN
SIFSKLPKFWEGDFHRDMEALNVLPPDVL
| |
| |
| |
| |
| |
Matching transcripts |
CARS-001 - ENSP00000380300 [100%]
CARS-002 - ENSP00000278224 [100%]
CARS-004 - ENSP00000369897 [100%]
CARS-016 - ENSP00000432619 [100%]
| | CARS-001 - ENSP00000380300 [100%]
CARS-002 - ENSP00000278224 [100%]
CARS-004 - ENSP00000369897 [100%]
CARS-016 - ENSP00000432619 [100%]
| | | | | | | | | |
Other gene match |
| | | | | | | | | | | |
|
ANTIBODY VALIDATION
|
|
|
Immunohistochemistry
|
|
Image |
 | |  | |  | |  | |  | |  | |
Description |
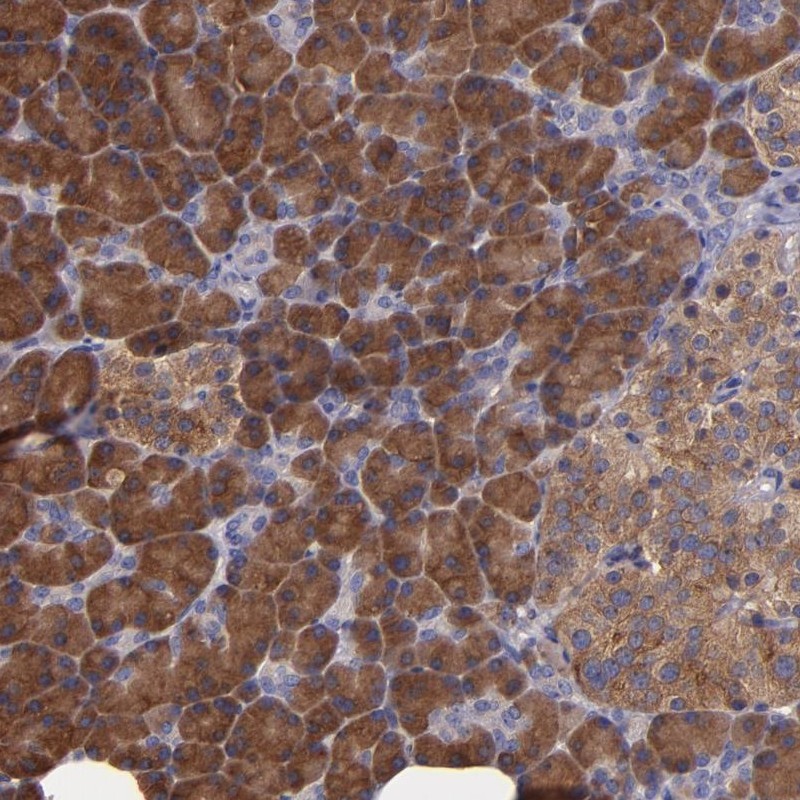
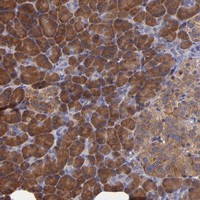
Immunohistochemical staining of human pancreas shows moderate positivity.
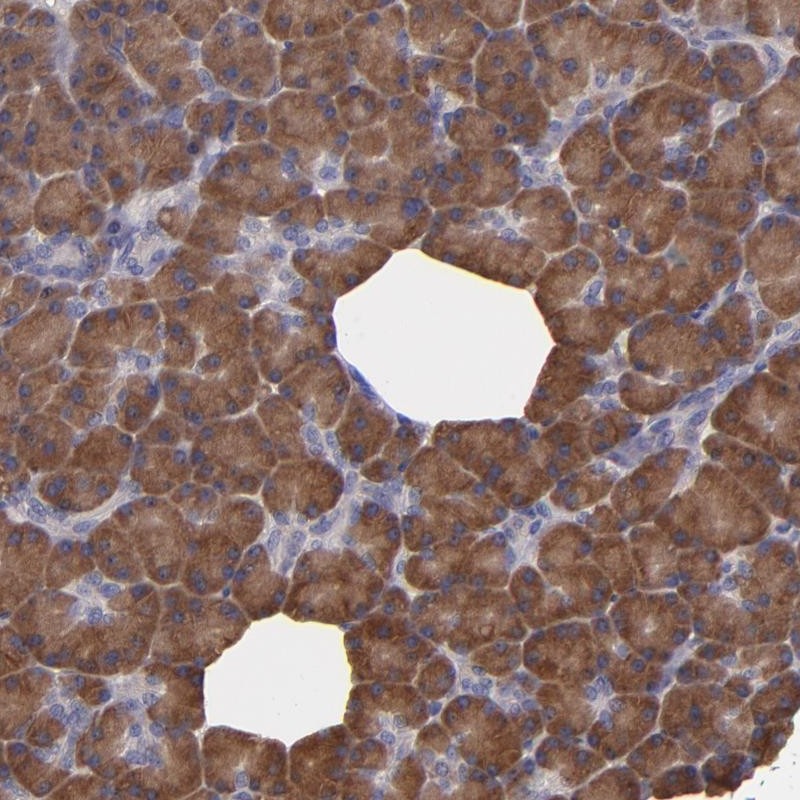
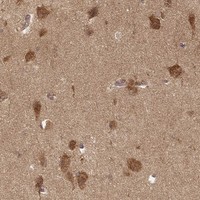
More information | | Immunohistochemical staining of human pancreas shows cytoplasmic positivity in exocrine glandular cells.
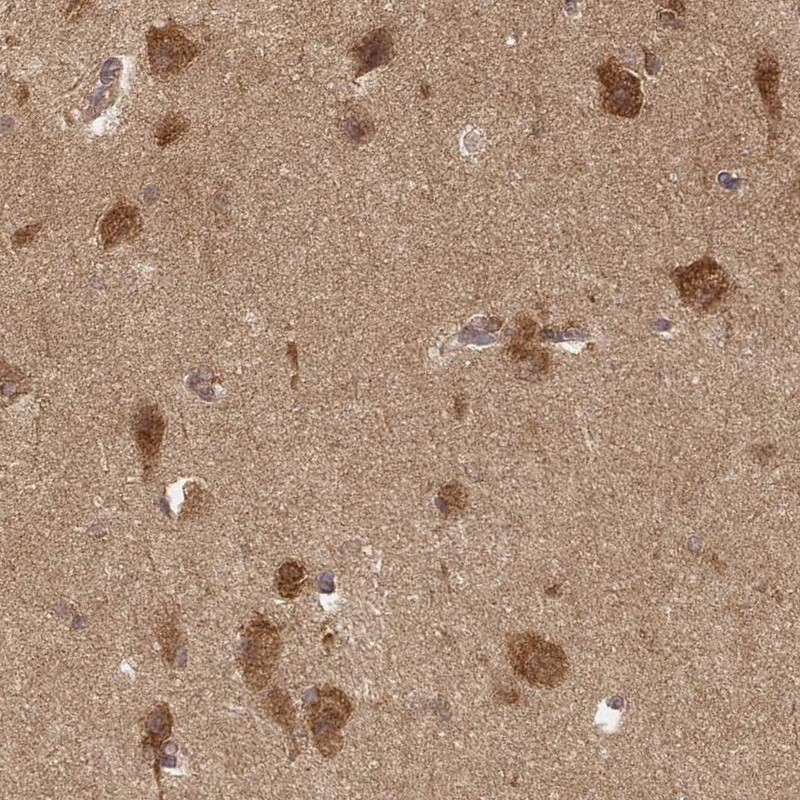
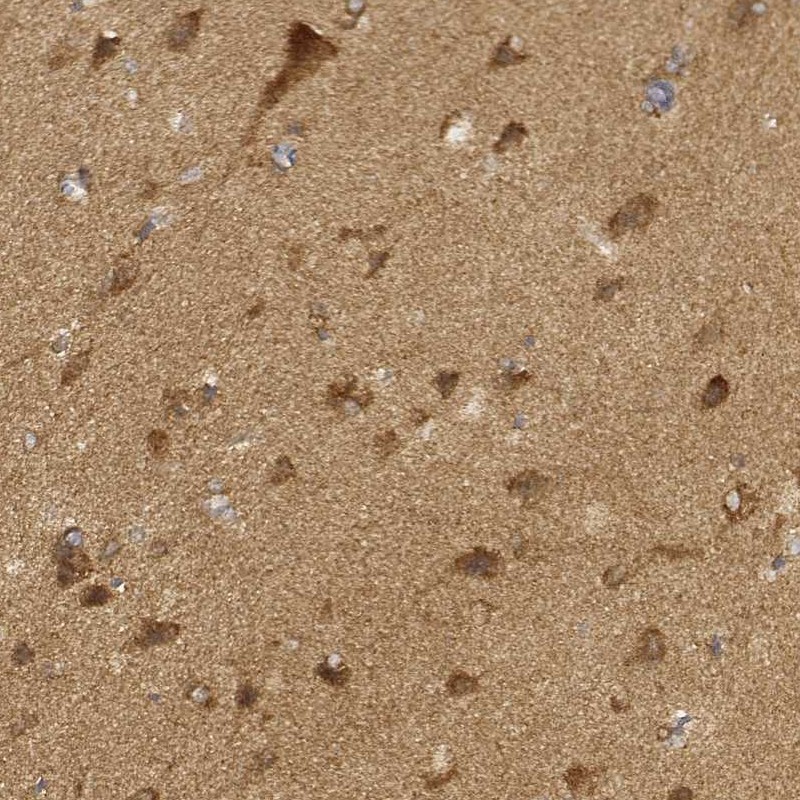
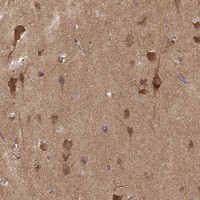
More information | | Immunohistochemical staining of human hippocampus shows cytoplasmic positivity in neurons.
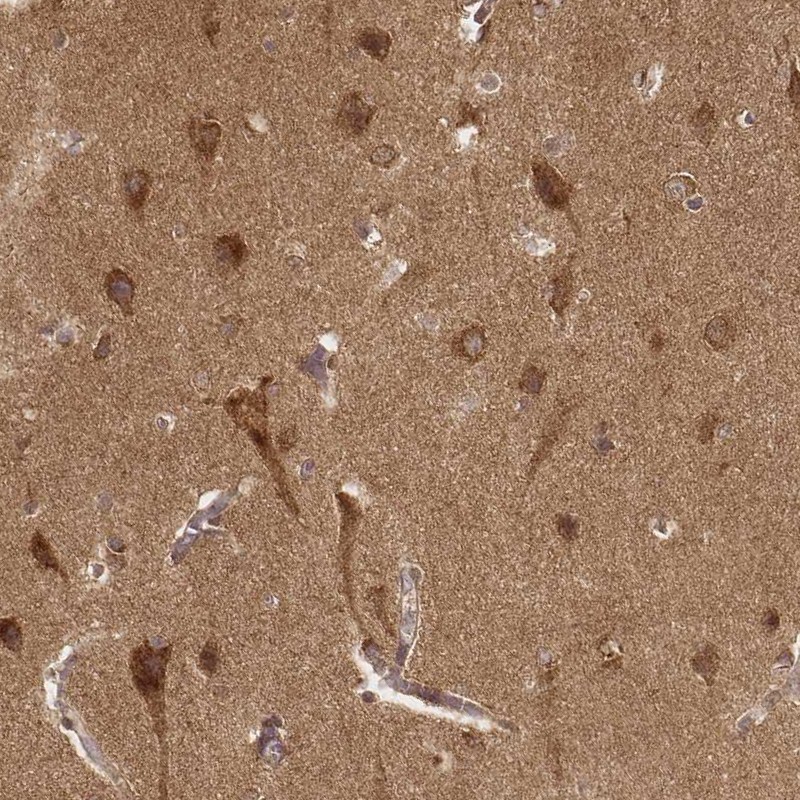
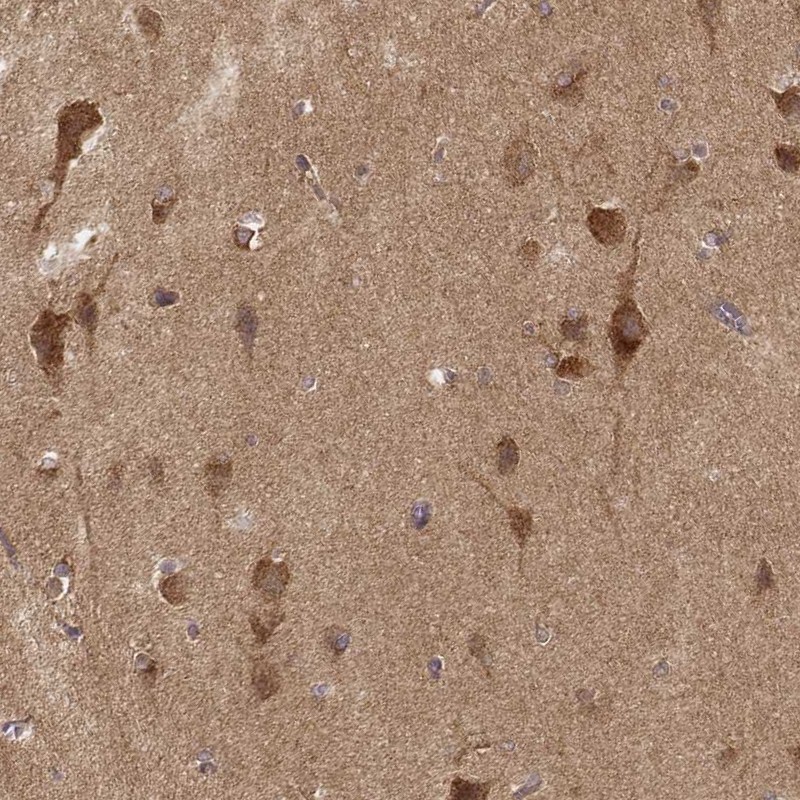
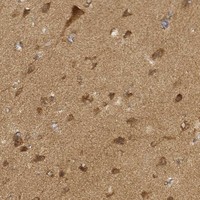
More information | | Immunohistochemical staining of human cerebral cortex shows cytoplasmic positivity in neurons.
More information | | Immunohistochemical staining of human cerebral cortex shows cytoplasmic positivity in neurons.
More information | | Immunohistochemical staining of human cerebral cortex shows strong cytoplasmic positivity in neuronal cells and glial cells.
More information | |
Retrieval method |
HIER pH6 | | HIER pH6 | | HIER pH6 | | HIER pH6 | | HIER pH6 | | HIER pH6 | |
Antibody dilution |
1:150 | | 1:1000 | | 1:2500 | | 1:70000 | | 1:27000 | | 1:17000 | |
Literature conformity |
Consistent with extensive gene/protein characterization data | | Consistent with extensive gene/protein characterization data | | Consistent with extensive gene/protein characterization data | | Consistent with extensive gene/protein characterization data | | Consistent with extensive gene/protein characterization data | | Consistent with extensive gene/protein characterization data | |
RNA consistency |
Mainly consistent with RNA expression data | | Mainly consistent with RNA expression data | | Mainly consistent with RNA expression data | | Mainly consistent with RNA expression data | | Mainly consistent with RNA expression data | | Mainly consistent with RNA expression data | |
|
Immunofluorescence
|
|
Image |
 | |  | | | | | | | | | |
Description |
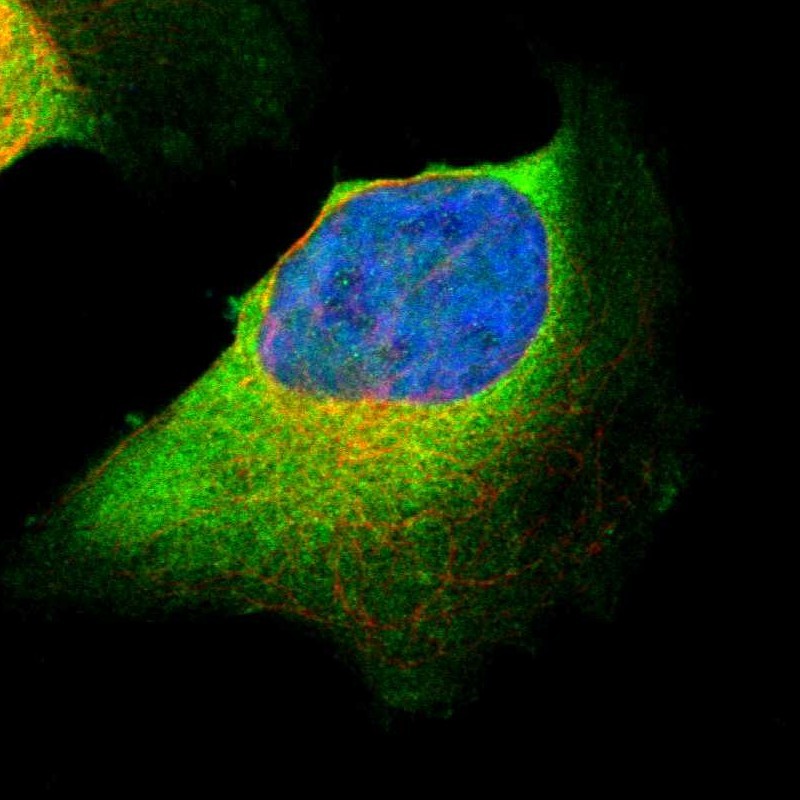
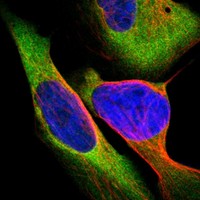
Immunofluorescent staining of human cell line U-2 OS shows positivity in cytoplasm.
More information | | Immunofluorescent staining of human cell line U-2 OS shows positivity in cytoplasm.
More information | | Application not done for this antibody. | | Application not done for this antibody. | | Application not done for this antibody. | | Application not done for this antibody. | |
Antibody dilution |
1:65 | | 1:105 | | | | | | | | | |
Validation IF |
Supportive: The subcellular location is supported by experimental gene/protein characterization data, gene silencing, or an independent antibody. | | Supportive: The subcellular location is supported by experimental gene/protein characterization data, gene silencing, or an independent antibody. | | | | | | | | | |
|
Western Blot
|
|
Image |
 | |  | |  | |  | |  | |  | |
Description |
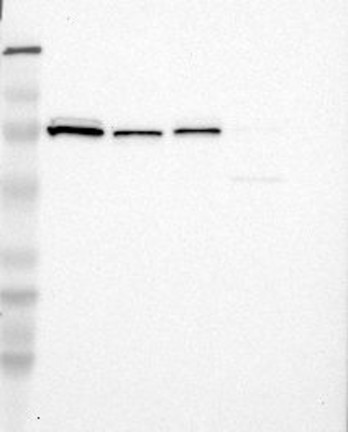
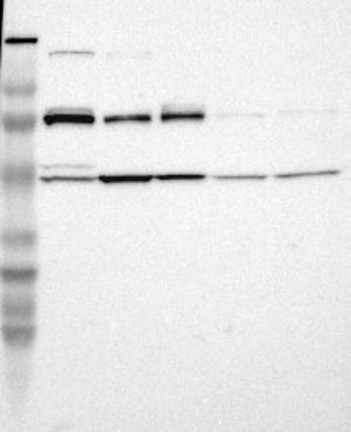
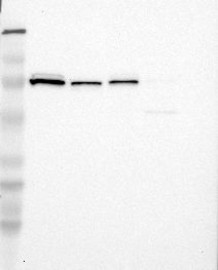
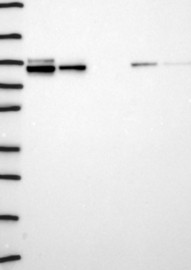
Lane 1: Marker [kDa] 206, 113, 82, 49, 32, 26, 17.8
Lane 2: RT4
Lane 3: U-251 MG
Lane 4: A-431
Lane 5: Liver
Lane 6: Tonsil
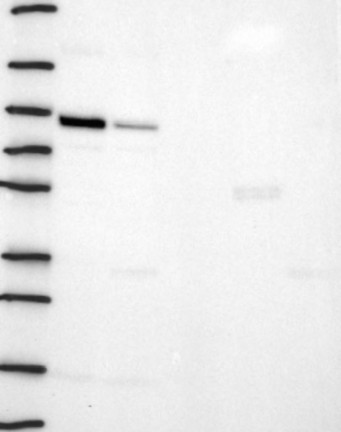
More information | | Lane 1: Marker [kDa] 206, 113, 82, 49, 32, 26, 17.8
Lane 2: RT4
Lane 3: U-251 MG
Lane 4: A-431
Lane 5: Liver
Lane 6: Tonsil
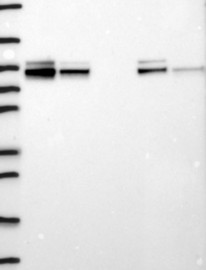
More information | | Lane 1: Marker [kDa] 250, 130, 95, 72, 55, 36, 28, 17, 10
Lane 2: RT4
Lane 3: U-251 MG
Lane 4: Human Plasma
Lane 5: Liver
Lane 6: Tonsil
More information | | Lane 1: Marker [kDa] 250, 130, 95, 72, 55, 36, 28, 17, 10
Lane 2: RT4
Lane 3: U-251 MG
Lane 4: Human Plasma
Lane 5: Liver
Lane 6: Tonsil
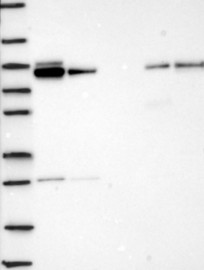
More information | | Lane 1: Marker [kDa] 250, 130, 95, 72, 55, 36, 28, 17, 10
Lane 2: RT4
Lane 3: U-251 MG
Lane 4: Human Plasma
Lane 5: Liver
Lane 6: Tonsil
More information | | Lane 1: Marker [kDa] 250, 130, 95, 72, 55, 36, 28, 17, 10
Lane 2: RT4
Lane 3: U-251 MG
Lane 4: Human Plasma
Lane 5: Liver
Lane 6: Tonsil
More information | |
Target mass (kDa) |
94.6, 85.5, 84.3, 82.8 | | 94.6, 85.5, 84.3, 82.8 | | 94.6, 85.5, 84.3, 82.8 | | 94.6, 85.5, 84.3, 82.8 | | 94.6, 85.5, 84.3, 82.8 | | 94.6, 85.5, 84.3, 82.8 | |
Antibody dilution |
1:250 | | 1:250 | | 1:500 | | 1:500 | | 1:500 | | 1:500 | |
Validation WB |
Supportive: Single band corresponding to the predicted size in kDa (+/-20%) | | Supportive: Band of predicted size in kDa (+/-20%) with additional bands present | | Supportive: Single band corresponding to the predicted size in kDa (+/-20%) | | Supportive: Band of predicted size in kDa (+/-20%) with additional bands present | | Supportive: Band of predicted size in kDa (+/-20%) with additional bands present | | Supportive: Single band corresponding to the predicted size in kDa (+/-20%) | |
|
Protein array
|
|
Image |
 | |  | | | | | | | | | |
Description |
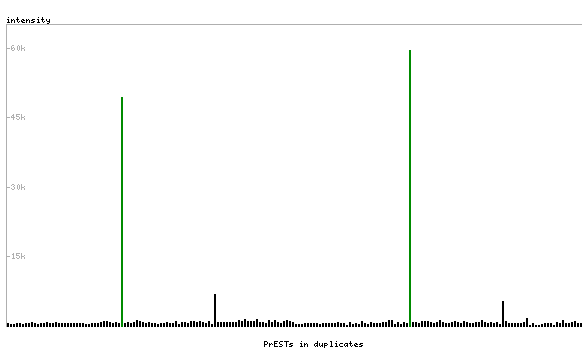
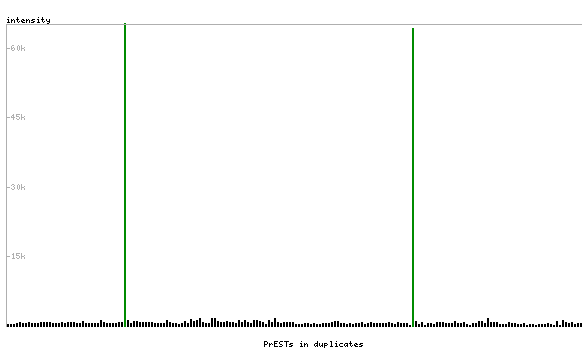
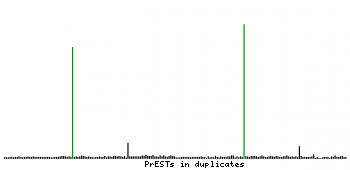
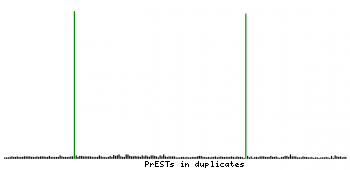
Antibody specificity analysis with protein arrays. Predicted and matching interactions are shown in green.
More information | | Antibody specificity analysis with protein arrays. Predicted and matching interactions are shown in green.
More information | | Application not done for this antibody. | | Application not done for this antibody. | | Application not done for this antibody. | | Application not done for this antibody. | |
Antibody dilution |
1:2000 | | 1:2000 | | | | | | | | | |
Validation PA |
Uncertain: Pass with quality comment low specificity (binding to 1-2 PrESTs >15% and <40%). | | Supportive: Pass with single peak corresponding to interaction only with its own antigen. | | | | | | | | | |
| |